Volatility RSI Breakout + Volume Filter [v6]This indicator is designed for my dca bot as entry signal. It combines four key conditions to generate high-probability buy/sell signals:
RSI Momentum Filter – Detects early strength or weakness before extreme overbought/oversold levels.
Bollinger Band Breakout – Confirms price expansion beyond recent volatility ranges.
Volume Spike Filter – Ensures breakout moves are supported by increased trader activity.
ATR Volatility Threshold – Trades are only allowed in sufficiently volatile environments.
The indicator plots:
Buy/Sell labels directly on the chart when all conditions are met.
Cari dalam skrip untuk "buy sell"

Confluence of signals# Confluence of Signals
## Overview
The "Confluence of Signals" is a powerful Pine Script indicator designed for TradingView that allows traders to define and visualize multiple technical conditions for both long and short trading signals. When all specified conditions align (reach confluence), the indicator generates a clear buy or sell signal, providing a structured approach to trading decision-making.
## Key Features
### Multiple Condition Support
- **8 Long Conditions**: Configure up to 8 different technical conditions for long entries
- **8 Short Conditions**: Configure up to 8 different technical conditions for short entries
- **Flexible Activation**: Enable or disable any condition based on your trading strategy
### Signal Types and Flexibility
- **Rich Condition Types**:
- Crossing (standard crosses)
- Crossing Up (bullish crosses)
- Crossing Down (bearish crosses)
- Greater Than (value comparisons)
- Less Than (value comparisons)
- Equals (exact matches)
- Rising (trend conditions over specified bars)
- Falling (trend conditions over specified bars)
- Toggle (signals that remain active for a specified number of bars)
### Multi-Timeframe Analysis
- Apply conditions from different timeframes
- Supports unified analysis across multiple chart periods
### Signal Management
- **Trade Limiting**: Set minimum bars between trades to avoid overtrading
- **Session Control**: Limit signals to specific trading sessions
- **Signal Expiration**: Set a date after which signals will no longer be generated
### Visual Feedback
- **Signal Table**: Clear BUY/SELL/NONE status display in the top-right corner
- **Condition Markers**: Visual indicators showing which specific conditions are active
- **Confluence Markers**: Triangle markers showing when all conditions align
- **Session Highlighting**: Optional background highlighting for the active session
## Usage Instructions
### Setting Up Conditions
1. Enable the conditions you wish to use by checking the "Use" option for each
2. Configure each condition with:
- **Source**: The price or indicator value to evaluate (e.g., close, SMA, RSI)
- **Event**: The type of condition (crossing, greater than, etc.)
- **Value/Source**: The threshold or comparison source
- **Timeframe**: Optional higher timeframe for the condition
- **Bar Close**: Whether the condition should only be evaluated on bar close
### Toggle Mode
For conditions set to "Toggle" mode:
1. Specify the number of bars the signal should remain active
2. The condition will remain true for the specified number of bars after triggering
3. Useful for conditions you want to remain valid for a certain period
### Trade Management
- **Bars Between Trades**: Prevents signals from occurring too frequently
- **Session Control**: Limit trading to specific market sessions
- **Expiration**: Set a cutoff date for all signals
### Visualization Controls
- Show/hide individual condition markers
- Show/hide confluence markers
- Enable/disable session highlighting
## Installation
1. Open TradingView and navigate to the Pine Editor
2. Copy the entire Confluence of Signals script
3. Paste it into the Pine Editor
4. Click "Save" and give your indicator a name
5. Click "Add to Chart" to apply the indicator
## Example Setups
### Simple Moving Average Crossover
- **Long Condition 1**: When (Close) Crossing Up (200 SMA)
- **Short Condition 1**: When (Close) Crossing Down (200 SMA)
### RSI with Support/Resistance
- **Long Condition 1**: When (RSI) Crossing Up (30)
- **Long Condition 2**: When (Close) Greater Than (50 SMA)
- **Short Condition 1**: When (RSI) Crossing Down (70)
- **Short Condition 2**: When (Close) Less Than (50 SMA)
### Multi-Timeframe Strategy
- **Long Condition 1**: When (Close) Greater Than (200 SMA)
- **Long Condition 2**: When (MACD) Crossing Up (Signal)
- **Short Condition 1**: When (Close) Less Than (200 SMA)
- **Short Condition 2**: When (MACD) Crossing Down (Signal)
## Best Practices
1. Start with fewer conditions and gradually add more as needed
2. Test different combinations of conditions to find optimal setups
3. Use the toggle feature for conditions that should remain valid for multiple bars
4. Consider using multi-timeframe conditions for confirmation from higher timeframes
5. Set appropriate trade limits to prevent overtrading
## Customization
The indicator can be further customized by modifying the script:
- Change colors and visual elements
- Add additional conditions if needed
- Modify the signaling logic
## Compatibility
- **Platform**: TradingView
- **Script Version**: Pine Script v5
- **Chart Types**: Compatible with all chart types
- **Timeframes**: Works on all timeframes
## Disclaimer
This indicator is provided for informational and educational purposes only. Always conduct your own analysis and risk management before making trading decisions. Past performance is not indicative of future results.
## Version History
- v1.0: Initial release with basic condition support
- v1.1: Added toggle functionality
- v1.2: Added multi-timeframe support
- v1.3: Added session control and expiration options
- v2.0: Expanded to 8 conditions for both long and short signals

VSA Simplified (Volume Spread Analysis)This indicator implements a simplified version of Volume Spread Analysis (VSA) to help traders identify key volume-based signals used by professional market participants.
It detects classic VSA patterns such as:
Climactic Volume: unusually high volume with wide price spread indicating potential buying/selling climax
No Demand / No Supply: low volume and small spreads signaling lack of interest or exhaustion
Stopping Volume: high volume with long wicks and neutral closes showing absorption or rejection
The indicator plots distinct shapes on the chart to highlight these conditions, assisting traders to read market intent and potential turning points.
Best used alongside market structure and support/resistance zones for confluence.

Patrik BTC Exponential Model v.2A MULTI-ANCHOR EULER'S EXPONENTIAL REGRESSION MODEL v2.0
Implements Euler's exponential growth model: BTC(t) = a × e^(r × t)
Based on Euler's number (e ≈ 2.71828) for natural exponential growth
- a = Initial coefficient (y-intercept in log space)
- r = Growth rate (slope in log space)
- t = Years since anchor date
FEATURES:
- Exponential regression line with ±2 SD bands
- R-squared for model fit assessment
- Log/linear regression modes
- Real-time deviation tracking
- Customizable anchor date
- BUY/SELL SIGNALS: Background zones & bar colors
- Green = Buy (below trend), Red = Sell (above trend)
- Darker colors = Stronger signals (±2 SD)
IMPORTANT CAVEATS:
⚠️ ANCHOR BIAS: Selecting "best fit" dates introduces look-ahead bias
⚠️ NOT PREDICTIVE: High R² shows historical fit, not future reliability
⚠️ For analysis only - NOT investment advice
TIPS:
- Use log scale (right-click price axis → "Logarithmic")
- ±2σ bands ≈ 95% confidence assuming normal distribution
- Signals: Strong Buy <-2σ | Buy <-1σ | Neutral | Sell >+1σ | Strong Sell >+2σ
- Note @GallantCryptoYT has a much more sophisticated exit / entry
CREDITS:
@GallantCryptoYT (Patreon: Gallant Crypto)

DP_MoneyFlow_Osc_V4**DP_Moneyflow_Osc_V4** is a custom, volume‐weighted momentum oscillator built around the classic Money Flow Index (MFI), with a few twists to help you spot more reliable reversal points:
***Best way to use it is to take the signals as alert points, to understand when money is starting to flow in or starting to flow out. It is not intended to be a Buy or Sell signal at the point of entry where the label is printed.***
1. **Core Calculation**
* Computes the standard MFI on your chart’s native timeframe:
* Money Flow = typical price (H+L+C)/3 × volume
* Segregates positive vs. negative flow based on whether price rose or fell on each bar
* Smooths each with an N-bar SMA, forms the ratio, and maps it into a 0–100 scale
2. **Inversion & Smoothing**
* You can **invert** the oscillator around 50 (so peaks become troughs and vice versa) with the **Reverse MFI** toggle.
* Applies two layers of smoothing (one for raw noise reduction, another for longer-term trend stability).
3. **Dynamic Coloring**
* Above Overbought (OB) threshold → solid red; below Oversold (OS) → solid green.
* In between, it linearly fades from red/green toward black as it approaches the 50 midpoint.
* **Invert Colors** flips the hue logic (red ↔ green) if you prefer.
4. **Overbought/Oversold Zones**
* Plots horizontal lines at your chosen OB/OS levels.
* Optionally fills the zone between them for quick visual reference.
5. **Peak/Trough Signal Labels**
* Detects **true extremes** by finding when the oscillator reverses direction right at or beyond your OB/OS levels.
* Prints a tiny “OB” or “OS” label **exactly at that pivot bar**, so you see the high or low of the swing.
6. **Alternation Toggle**
* Prevents two consecutive “OS” or “OB” labels by enforcing strict Buy/Sell alternation—turn this on or off via **Enable Signal Alternation**.
---
**Use-Case**: This oscillator excels at pinpointing the *tops* and *bottoms* of strong volume‐backed moves, giving you clear pivot markers rather than every threshold crossover. Tweak the smoothing and threshold inputs to calibrate sensitivity to your market and timeframe.

tp_sl_styling_libTP/SL Styling Library
A professional-grade library for creating highly customizable trade management visualizations with extensive styling options and multiple display versions. Perfect for indicators and strategies that require consistent, professional-looking trade level drawings.
Key Features - Extensive Styling Options
Multiple Visual Styles
Version 1 : Traditional multi-label style with left/center/right positioning
Version 2 : Modern streamlined style with single-side labels and tooltips
Version 3 : Advanced style with directional arrows (▲/▼) and bar-level indicators
Comprehensive Customization
Line Styles : Solid, Dashed, Dotted for all levels
Line Thickness : Individual thickness control for each level
Color Schemes : Separate colors for TP1, TP2, TP3, SL, Entry, Buy/Sell signals
Label Positioning : Flexible left/center/right positioning for all information
Information Display : Configurable display of prices, R:R ratios, percentages, and position sizes
Professional Features
Memory Management : Proper cleanup functions prevent memory leaks
Dynamic Line Adjustment : Automatic line length adjustment based on chart view
Tooltip Integration : Hover information for all trade levels
Bad R/R Detection : Special visualization for poor risk/reward scenarios
What Makes This Library Unique
Unlike basic drawing functions, this library provides:
3 Different Visual Styles to match any trading strategy aesthetic
Granular Control over every visual element (colors, styles, thickness, positioning)
Professional Consistency across all your indicators and strategies
Memory-Efficient design with proper cleanup methods
Future-Proof architecture with version-based feature progression
Usage Example
//@version=5
indicator("My Strategy")
import bilsebub/tp_sl_drawing_lib/1 as tpsl
// Choose your preferred visual style
var VERSION = input.int(3, "Drawing Style", minval=1, maxval=3, options= )
// Extensive styling options
var TP1_STYLE = input.string("Solid", "TP1 Line Style", options= )
var TP1_THICKNESS = input.int(2, "TP1 Thickness", minval=1, maxval=5)
var TP1_COLOR = input.color(color.green, "TP1 Color")
var LABEL_POS = input.string("Right", "Label Position", options= )
var SHOW_PRICES = input.bool(true, "Show Prices")
var SHOW_RR = input.bool(true, "Show Risk/Reward")
// Create professional trade drawings
var drawings = tpsl.tradeDrawingsUnion.new()
if entrySignal
tpsl.remove_trade_drawings(VERSION, drawings)
drawings := tpsl.draw_trade_tp_sl(
version=VERSION,
direction=1, // 1 for buy, -1 for sell
ep=entry_price,
tp1=take_profit1,
tp2=take_profit2,
tp3=take_profit3,
sl=stop_loss,
rrr=risk_reward_ratio,
show_tp1=true,
show_tp2=true,
show_tp3=false,
show_sl=true,
show_ep=true,
tp_sl_label_pos=LABEL_POS,
tp_sl_price_pos=SHOW_PRICES ? LABEL_POS : "None",
tp_sl_rrr_pos=SHOW_RR ? LABEL_POS : "None",
tp1_style=TP1_STYLE,
tp1_thickness=TP1_THICKNESS,
tp1_color=TP1_COLOR
// ... additional styling parameters
)
Main Functions
Core Drawing Functions
draw_trade_tp_sl() - Create complete trade visualization with all styling options
draw_bad_rrr() - Special visualization for poor risk/reward scenarios
remove_trade_drawings() - Clean up all drawings to prevent memory issues
remove_trade_drawings_labels() - Remove only labels while keeping lines
shrink_lines() - Dynamically adjust line lengths based on chart view
Data Types
tradeDrawingsV1 - Traditional multi-label style
tradeDrawingsV2 - Modern streamlined style
tradeDrawingsV3 - Advanced style with directional indicators
tradeDrawingsUnion - Unified interface for all versions
Perfect For
Professional Indicators requiring consistent trade visualization
Trading Strategies with multiple take profit levels
Educational Content with clear trade management displays
Algorithmic Trading systems needing reliable drawing functions
Custom Indicators requiring extensive styling flexibility
Pro Tips
Choose the Right Version : V1 for detailed info, V2 for clean look, V3 for modern style
Memory Management : Always call remove_trade_drawings() before creating new ones
Styling Consistency : Use the same color scheme across all your indicators
Performance : Use shrink_lines() for dynamic line adjustment on large charts
Version Comparison
Label Positions:
V1 (Traditional) : Left/Center/Right positioning available
V2 (Modern) : Right-side positioning only
V3 (Advanced) : Right-side + Bar-level positioning
Directional Indicators:
V1 (Traditional) : ❌ Not available
V2 (Modern) : ❌ Not available
V3 (Advanced) : ✅ Available (▲/▼ arrows)
Tooltips:
V1 (Traditional) : ❌ Not available
V2 (Modern) : ✅ Available
V3 (Advanced) : ✅ Available
Bar-Level Markers:
V1 (Traditional) : ❌ Not available
V2 (Modern) : ❌ Not available
V3 (Advanced) : ✅ Available
Memory Efficiency:
V1 (Traditional) : Good
V2 (Modern) : Better
V3 (Advanced) : Best
Note : This library is designed for professional use and provides extensive customization options. Choose the version that best fits your visual style and requirements.
Main Functions:
shrink_lines(version, start_idx, min_bars_label_length, drawings)
Parameters:
version (int)
start_idx (int)
min_bars_label_length (int)
drawings (tradeDrawingsUnion)
draw_bad_rrr(version, ep, rrr, min_bars_label_length, ep_thickness, ep_color)
Parameters:
version (int)
ep (float)
rrr (float)
min_bars_label_length (int)
ep_thickness (int)
ep_color (color)
remove_trade_drawings(version, drawings)
Parameters:
version (int)
drawings (tradeDrawingsUnion)
remove_trade_drawings_labels(version, drawings)
Parameters:
version (int)
drawings (tradeDrawingsUnion)
draw_trade_tp_sl(version, direction, ep, tp1, tp2, tp3, sl, rrr, tp1_perc, tp2_perc, tp3_perc, sizeInfo, patternStartBarIdx, tp_sl_line_length, show_tp1, show_tp2, show_tp3, show_sl, show_ep, show_size_info, tp_sl_label_pos, tp_sl_price_pos, tp_sl_rrr_pos, tp_sl_perc_pos, tp_sl_qty_pos, tp1_style, tp2_style, tp3_style, sl_style, ep_style, tp1_thickness, tp2_thickness, tp3_thickness, sl_thickness, ep_thickness, tp1_color, tp2_color, tp3_color, sl_color, ep_color, buy_color, sell_color)
Parameters:
version (int)
direction (int)
ep (float)
tp1 (float)
tp2 (float)
tp3 (float)
sl (float)
rrr (float)
tp1_perc (float)
tp2_perc (float)
tp3_perc (float)
sizeInfo (string)
patternStartBarIdx (int)
tp_sl_line_length (int)
show_tp1 (bool)
show_tp2 (bool)
show_tp3 (bool)
show_sl (bool)
show_ep (bool)
show_size_info (bool)
tp_sl_label_pos (string)
tp_sl_price_pos (string)
tp_sl_rrr_pos (string)
tp_sl_perc_pos (string)
tp_sl_qty_pos (string)
tp1_style (string)
tp2_style (string)
tp3_style (string)
sl_style (string)
ep_style (string)
tp1_thickness (int)
tp2_thickness (int)
tp3_thickness (int)
sl_thickness (int)
ep_thickness (int)
tp1_color (color)
tp2_color (color)
tp3_color (color)
sl_color (color)
ep_color (color)
buy_color (color)
sell_color (color)

AlphaTradeAlphaTrade - Smart Trend & Volume Signal Indicator
AlphaTrade is a powerful combination of Zero Lag Trend and Volumatic VIDYA to help traders make smarter entries and exits.
This script provides:
Accurate Buy/Sell Labels: Based on Zero Lag Trend crossover logic with adaptive volatility bands.
Volume-Based Zones: Highlights key liquidity areas with real-time volume annotations.
VIDYA Trend Shading: Adaptive VIDYA-based cloud colored by volume momentum and trend direction.
Multi-Timeframe Table: Displays the trend status on 5, 15, 60, 240 minutes and 1D timeframes.
Delta Volume Label: Live buy/sell volume comparison and percentage delta.
Auto Liquidity Lines: Automatically draws recent high/low levels with volume at that level.
Alerts Ready: Receive "ALIM" (Buy) and "SATIM" (Sell) alerts instantly.
Ideal for traders who want trend precision, volume confirmation, and visual clarity — all in one tool.
For best results, apply on high-liquidity assets and adjust ZLEMA/VIDYA settings to your strategy.

BOLL + RSI 趋势信号📘 Strategy Name
BOLL + RSI Dot Cluster Strategy (Unfiltered Base Version)
⸻
🎯 Overview
This strategy combines Bollinger Bands (BOLL) with the Relative Strength Index (RSI) to identify short-term overbought and oversold conditions. By detecting when price breaks out of the BOLL channels and confirming with RSI extremes, the strategy generates buy/sell signals with graded strength, visualized through stacked colored dots on the chart.
⸻
🔍 Core Logic
🟢 Buy Signal Conditions:
• Price closes below the lower Bollinger Band, indicating potential market oversold conditions or capitulation;
• RSI is below the oversold threshold (default: 30), confirming technical oversold status;
• When both conditions are met, a buy signal is generated.
🔴 Sell Signal Conditions:
• Price closes above the upper Bollinger Band, suggesting a sharp short-term rally;
• RSI is above the overbought threshold (default: 70), confirming technical overbought status;
• When both conditions are satisfied, a sell signal is triggered.
⸻
📊 Signal Strength Scoring System
Each signal is scored from 1 to 5 based on:
Dimension Logic Score Range
RSI Score Based on how extreme the RSI is (e.g. >90 or <10 scores highest) 1–5
Price Distance Score Based on the percentage deviation of the current price from the Bollinger middle band 1–5
• The final signal strength is the average of both scores (rounded), capped at 5.
• Signals are visualized as 1 to 5 stacked dots (green for buy, red for sell) above or below the candles.
⸻
🧭 Use Cases & Suitability
• Designed as a visual manual trading aid;
• Can serve as a signal confirmation module for other strategies;
• Particularly suited for volatile assets such as BTC, ETH, altcoins, and momentum stocks;
• Works well on 1H, 4H, or daily charts;
• Not recommended for blindly shorting during strong uptrends (unless used with stop-loss logic).
⸻
⚠️ Key Characteristics & Limitations
• This is a base version — no trend filters, cooldown mechanisms, or lockouts are applied;
• May generate consecutive opposite signals during strong trends (e.g., repeated sell signals during an uptrend);
• Users are encouraged to customize or enhance this strategy with:
• Trend filters (e.g., EMA, MACD);
• Cooldown intervals;
• Volume or divergence confirmations;
• All signals are probabilistic and do not constitute financial advice.
⸻
🔔 Visual Guide
• Green dots stacked below candles represent buy signals;
• Red dots stacked above candles represent sell signals;
• The number of dots = signal strength (1–5);
• Bollinger Bands are plotted in white, the midline in yellow, with a subtle white background channel.

Custom Buy/Sell Indicator with AlertsGives buy and sell indicators based on VWAP and order imbalance

1-Min Change of State Buy/Sell SignalBuy & Sell Indicator. Calls a signal based on break of structure, momentum and trend

1-Min Change of State Buy/Sell SignalBuy & Sell Indicator. signals a trade based on BOS (Break of Structure), Momentum, and trend

SuperTrend Adaptive (STD Smooth)Supertrend Adaptive (Smoothed StdDev)
Supertrend Adaptive is a refined trend-following indicator based on the classic Supertrend. It enhances the original by incorporating smoothed standard deviation into the volatility calculation, instead of relying solely on ATR. This hybrid approach enables more responsive and adaptive trend detection, reducing noise and false signals in volatile or ranging markets. The indicator also features confidence-weighted signal labels and a clean, uncluttered display, making it practical for any trading timeframe.
🔍 Detailed Methodology and Conceptual Foundation
Unlike traditional Supertrend indicators that use only absolute volatility (ATR) to define trend bands, this version blends standard deviation — a relative volatility measure — into the calculation. Standard deviation helps capture the dispersion of price, not just its range, and when smoothed, it filters out erratic jumps caused by sudden spikes or drops.
This fusion creates trend bands that expand and contract dynamically based on recent price variability. As a result:
Fewer whipsaws : The trend bands adjust to both low and high volatility environments, which helps avoid unnecessary signal flips during consolidation.
Stronger trend adherence : Signals are less reactive to momentary price movements. This allows the indicator to hold positions longer in trending markets, giving traders the opportunity to ride extended moves.
Bollinger Band-style adaptation : By including standard deviation, this indicator behaves similarly to Bollinger Bands — accounting for relative price change rather than absolute moves alone.
These enhancements make the tool suitable not only for identifying directional bias, but also for refining entries and exits with more context-aware volatility filtering.
📈 How to Use the Indicator
Trend Direction: The script draws a colored line beneath (uptrend) or above (downtrend) price. Green indicates bullish trend, red indicates bearish.
Buy/Sell Labels: Only the most recent signal is shown to reduce clutter:
🟢 Green "Buy" label = trend reversal to bullish, with strong confidence.
🔵 Blue "Buy" label = same reversal, but with lower volume confidence.
🔴 Red "Sell" label = trend reversal to bearish, with strong confidence.
🟠 Orange "Sell" label = bearish signal with lower volume confidence.
These color codes are derived from comparing current volume to its average — a higher-than-average volume gives greater confidence to the signal.
Settings:
ATR Period: Controls the smoothing window for volatility calculation.
ATR Multiplier: Adjusts the size of the trend bands.
Std Smooth: Controls smoothing applied to standard deviation to reduce jitter.
Change ATR Method: Option to toggle between default and smoothed ATR.
Show Signals: Toggle for label display.
📢 Alerts
The script includes three built-in alert conditions:
Buy Signal: Triggered when the trend flips to bullish.
Sell Signal: Triggered when the trend flips to bearish.
Trend Direction Change: Alerts on any switch in trend regardless of confidence level.
These alerts allow traders to automate notifications or integrations with bots or trading platforms.
🧼 Clean Chart Display
To ensure clarity and comply with best practices:
The chart shows only this indicator.
Trend lines are drawn in real time for visual context.
Only one label per direction is shown — the most recent one — to keep the chart readable.
No drawings or unrelated indicators are included.
This setup ensures the script’s signals and structure are immediately understandable at a glance.
📌 Best Use Cases
This tool is designed for:
Traders who want adaptive volatility filters instead of rigid ATR-based models.
Scalpers and swing traders who prefer clean charts with minimal lag and fewer false signals.
Any asset class — works well on crypto, FX, and equities.
Shortcoming of this tool is sideway price action (will be tackled in next versions).
Credit for www.tradingview.com the version which this script extends.

Aggressive Volume Indications + SupertrendVolume Precision: The aggressive volume logic is well-designed to filter for conviction-backed price movement. Using (high - low) * 0.7 as the body filter adds a nice touch to weed out noise.
Customizability: The script allows for tunable inputs on both the volume and trend side, which gives flexibility across different instruments or timeframes.
Trend Detection Logic: Your use of persistent variables to track supertrend and trendUp adds robustness to the trend-following element.
💡 Suggestions:
Optional Signal Confirmation: You could incorporate a confirmation mechanism—like checking if price closes above or below the Supertrend line before plotting the aggressive volume markers. That might help filter out traps during ranging markets.
Barcolor or Background Highlighting: For visual clarity, adding barcoloring based on aggressive buying/selling might amplify signal visibility.
Entry/Exit Potential: Consider integrating a simple crossover strategy to simulate entries based on these signals—especially since you're already working on a Nifty 50 script with market psychology in mind.

Sistema Bitcoin CompletoBitcoin Complete System - Advanced Scalping & Main Strategy
📊 Overview
This comprehensive Bitcoin trading system combines multiple momentum indicators to identify high-probability entry points across different timeframes. The indicator automatically adapts its behavior based on the selected timeframe and provides two distinct trading approaches.
🎯 Key Features
Dual System Architecture: Scalp system (3m/5m) and Main system (15m+)
Advanced Convergence Logic: Requires multiple indicators to align before signaling
Dynamic Information Panel: Real-time display of indicator states and convergence status
Automated Timeframe Detection: Optimizes settings based on current chart timeframe
Bitcoin-Focused: Specifically designed for BTC/USD trading pairs
⚡ Scalp System (3m/5m Timeframes)
Signal Requirements
Long Signal (Yellow Circle Below Bar):
Williams %R ≤ -80 (Oversold)
Stochastic %K ≤ 20 (Oversold)
RSI ≤ 33 (Deep Oversold)
ALL THREE must be satisfied simultaneously
Short Signal (Yellow Circle Above Bar):
Williams %R ≥ -20 (Overbought)
Stochastic %K ≥ 80 (Overbought)
RSI ≥ 67 (Deep Overbought)
ALL THREE must be satisfied simultaneously
Scalp Strategy Logic
The scalp system uses a strict convergence approach where divergence between indicators results in NO signals. This dramatically reduces false signals and increases accuracy by ensuring all momentum indicators are aligned in the same direction.
📈 Main System (15m+ Timeframes)
Scoring Algorithm
The main system uses a sophisticated scoring mechanism that evaluates multiple confluence factors:
Buy Signals (Green Triangle + Score):
Williams %R oversold: +1 point
Stochastic oversold: +1 point
RSI touching oversold line (25-35): +0.5 points
RSI breaking oversold line (≤30): +1 point
RSI extremely low (≤20): +2 points
High volume: +1 point
Price near EMA 200: +0.5 points
Price near Fibonacci 61.8%: +0.5 points
Sell Signals (Red Triangle + Score):
Williams %R overbought: +1 point
Stochastic overbought: +1 point
RSI touching overbought line (65-75): +0.5 points
RSI breaking overbought line (≥70): +1 point
RSI extremely high (≥80): +2 points
High volume: +1 point
Price near EMA 200: +0.5 points
Price near Fibonacci 50%: +0.5 points
Signal Classification
🔥 ULTRA PREMIUM: Score ≥ 6 points
💎 PREMIUM: Score ≥ 4 points
💪 STRONG: Score ≥ 3 points
⚡ MEDIUM: Score < 3 points
🔧 Configuration Options
General Settings
Show Information Panel: Display real-time indicator values and convergence status
Show Support/Resistance Levels: Plot EMA and Fibonacci levels
Main System Settings
Minimum Score: Threshold for signal generation (default: 3)
Use Fibonacci: Enable/disable Fibonacci retracement levels
Scalp System Settings
Double Alerts: Enable progressive alert system
📱 Information Panel
The dynamic information panel shows:
Current timeframe and system type
Real-time indicator values and states
Convergence status for each signal type
Signal requirements and current status
🚨 Alert System
Comprehensive alert notifications for:
Scalp signals (possible and activated)
Main system buy/sell signals
Custom messages with price, timeframe, and confluence details
🎮 How to Use
Add to Chart: Apply indicator to Bitcoin chart
Select Timeframe: Choose 3m/5m for scalping or 15m+ for main strategy
Monitor Panel: Watch convergence status in real-time
Set Alerts: Configure notifications for your preferred signals
Confirm Signals: Always verify with price action and market context
⚠️ Important Notes
Bitcoin Only: Designed specifically for BTC trading pairs
Convergence Required: No signals appear during indicator divergence
Real-time Updates: Panel updates continuously with market data
Risk Management: Always use proper position sizing and stop losses
🔍 Advanced Features
Volume Confirmation: Higher volume adds to signal strength
Fibonacci Integration: Automatic calculation of key retracement levels
Multi-timeframe Optimization: Different logic for different timeframes
State Persistence: Tracks indicator conditions across bars
This system represents a sophisticated approach to Bitcoin trading, combining the precision of multiple momentum indicators with the flexibility to adapt to different trading styles and timeframes.

Moving Average Crossover Fast Moving Average (default: 9-period ) — reacts quickly to price changes.
Slow Moving Average (default: 21-period ) — smooths out long-term trends.
How It Works:
A Buy Signal is generated when the fast MA crosses above the slow MA, indicating potential upward momentum.
A Sell Signal is triggered when the fast MA crosses below the slow MA, signaling possible bearish momentum.
Features:
Customizable fast and slow MA periods.
Clear BUY/SELL labels directly on the chart.
Works on any timeframe or asset (stocks, crypto, forex, etc.).
Great for trend-following and swing trading strategies.

Intraday Volume by Saurabh Maggoinspired by volume indicator by nitin
Key Features
Dynamic Volume Visualization: Features thicker volume bars with color-coded insights—grey for normal volume (0.5x-1.5x baseline), orange for low volume (<0.5x), blue for Intraday Pocket Pivots (IPP), green for high up volume, and red for high down volume.
Snort Signals: Identifies strong moves with green Bull Snorts (below bars) and red Bear Snorts (above bars), triggered by volume exceeding 2.0x the baseline with significant price action.
Highest/Lowest Volume Markers: Blue squares mark the highest volume bar, and a single orange square marks the first lowest volume bar, aiding trend identification.
Enhanced Table Metrics: A 2x3 table displays Trend Strength (TS, green >100%, red <100%), Buy/Sell Signal (BS, green "Buy", red "Sell", grey "Neutral"), and Net Pressure (NP, green >0%, red <0%), offering a comprehensive view of volume and price pressure, reset daily at 9:15 AM IST.

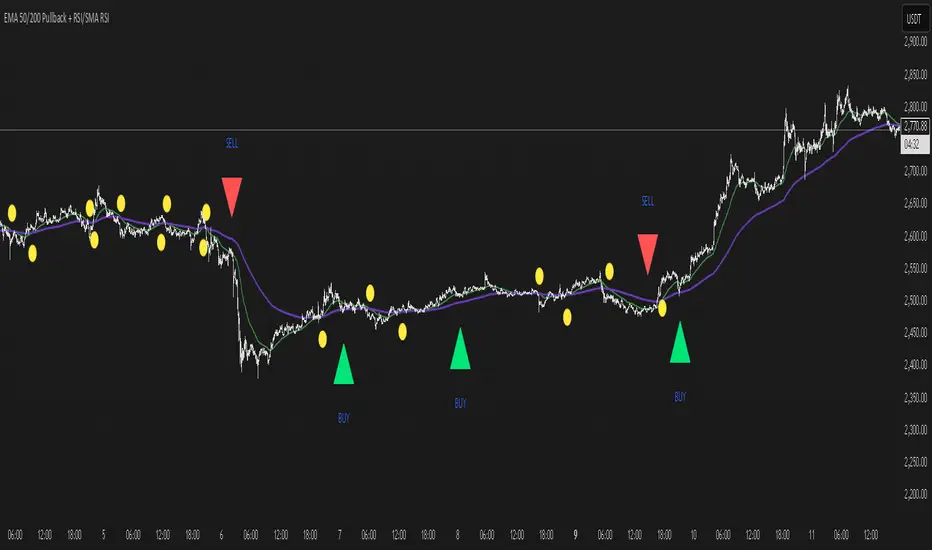
EMA 50/200 Pullback + RSI/SMA RSI
Strategy Description: EMA 50/200 Pullback + RSI/SMA RSI
1. Trend Identification with EMA:
Uses two Exponential Moving Averages (EMA): a fast EMA (default 50) and a slow EMA (default 200).
When the fast EMA crosses above the slow EMA (bullish crossover), an uptrend is identified.
When the fast EMA crosses below the slow EMA (bearish crossover), a downtrend is identified.
The lengths of both EMAs are fully customizable.
2. EMA Distance Condition:
Signals are only valid when the absolute percentage distance between the two EMAs is within a user-defined range (default: 0.4% to 1%).
This helps filter out weak signals when the EMAs are too close or too far apart.
3. Pullback Condition:
After a new trend is detected (EMA crossover), the strategy waits for the price to pull back to touch or cross the fast EMA (EMA 50).
This ensures entries are not taken immediately at the crossover, but after a retracement to a dynamic support/resistance area.
4. RSI Confirmation:
Uses the RSI indicator (default 14) and its Simple Moving Average (SMA RSI, default 14).
Buy signal: RSI crosses above its SMA.
Sell signal: RSI crosses below its SMA.
Both RSI and SMA RSI lengths are fully customizable.
5. Entry Rules:
The indicator only gives the first buy/sell signal after each EMA crossover (start of a new trend), and will not repeat signals until the next EMA crossover.
Buy signal:
Fast EMA crosses above slow EMA
EMA distance is within the valid range
Price pulls back to the fast EMA
RSI crosses above its SMA
Sell signal:
Fast EMA crosses below slow EMA
EMA distance is within the valid range
Price pulls back to the fast EMA
RSI crosses below its SMA
6. Customization:
All parameters (EMA lengths, RSI length, SMA RSI length, EMA distance range) can be adjusted in the indicator’s settings.
Note:
This is a signal indicator, not a complete trading strategy. For real trading, always combine with risk management and additional confirmations.
4-EMA Signals + MTF Analysis4-EMA Signals + MTF Analysis Indicator: User Guide
This indicator is designed for active traders; from scalpers / intra-day traders to swing-traders who simply want an easy to understand, simple, but yet comprehensive and easy-to-understand indicator with a quick overview of initial market momentum and overall market direction to assist the trader in their initial trading.
The main feature of this indicator is that It overlays four exponential moving averages (EMAs), and provides a dashboard of real-time trend signals for both buy and sell (long/short) scenarios.
Settings Overview
MA Period Setup
Custom: Set your own EMA periods.
Conservative, Aggressive, Fibonacci: Quickly apply preset EMA period combinations for different trading styles.
EMA Periods (Custom Setup)
Fast EMA: Shortest EMA, reacts quickly to price (default 7).
Medium-Short EMA: Intermediate speed (default 25).
Medium-Long EMA: Slower, filters out more noise (default 70).
Slow EMA: Longest-term trend (default 200).
(These settings can be adjusted to suit your individual needs)
Main Indicator Features
Four EMAs : Plotted in distinct colors (green, yellow, orange, red) for quick trend recognition - this can be altered in colour to your personal preferences.
Buy/Sell Signals : Triangles appear below/above bars when EMA crossovers occur, optionally filtered by volume - the volume filter when applied greatly reduces the influx of signals, only giving high-quality signals!
Trading Sessions + Backgrounds : A trading session feature has been added: (London, New York, Asia, Sydney) with the choice of a background to indicate each global trading session.
Volume Overlay : Volume bars and a blue volume moving average line for context.
Dashboard Table (Top Right):
Market Direction: Shows the overall EMA alignment (bullish, bearish, weak, consolidating).
The initial trend on the 5m, 15m, 1H, and 4H time-frame to give a quick snapshot of overall trend direction.
How to Use
Trend Identification :
-- Use the EMA alignment and dashboard table to quickly see if the market is bullish, bearish, or consolidating.
EMA Set-up
-- Adjust the EMA settings to your specific requirements, the signals will alter depending on the volatility of the instrument your trading.
Signal Confirmation :
-- ''Buy'' signals simply appear when the faster EMAs cross above slower EMAs in and ''Sell'' signals simply appear when they cross below.
Volume Context :
--Use the volume moving average and the optional volume filter to avoid signals during low-activity periods.
No Repainting :
-- All signals and dashboard readings are calculated using only confirmed, closed bars. What you see in real time is exactly what will appear in your back-test — no repainting or look-ahead bias.
Alerts / Notifications
Now for the fun part:
1. Enable Buy/Sell Signal Alerts: Get notifications when buy or sell signals occur.
2. For Alerts to function correctly, set the ''condition'' to the indicator itself.
3. Select ''EMA Bearish Cross'' or ''EMA Bullish Cross'' depending whether you want alerts for either buy/sell signals - Or one can simply set alerts for both scenarios.
4. For ''Interval'' set to ''Same as chart'' - So, the time-frame which you'd like to trade on.
5. For ''Trigger'' set to ''Once Per Bar Close''.
6. Save.
7. Wait for a signal to occur!
NOTE: Before placing a trade, it's often best to also assess the market conditions at that time also - and not rely solely on the signals, the signals are to assist, and it's often occurred a signal has shown, but a pull-back occurs, and a FVG in discount holds -- it's this FVG holding, accompanied by volume, that's the real entry, possibly.
Tip: For the cleanest results, use the indicator during the most active sessions and always check multi-time-frame trend alignment before entering trades. Good Luck! :)

BSL & SSL - Liquidity Zones
BSL & SSL - Liquidity Zones
Indicator Description (for TradingView)
Concept
The BSL & SSL - Liquidity Zones indicator is a simple yet powerful visual tool that helps traders identify key liquidity zones in the market by tracking prominent highs and lows on the chart.
It is based on the concept that the Highest High (Buy Side Liquidity - BSL) and Lowest Low (Sell Side Liquidity - SSL) represent zones where stop-loss orders and pending orders accumulate — often attracting future price movements.
Purpose
This indicator helps traders spot hidden liquidity levels which may act as targets or potential reversal points. It is especially useful for traders who apply Smart Money Concepts (SMC) or institutional trading models.
Great for detecting potential stop hunts and understanding market structure shifts.
How It Works
The indicator calculates the Highest High and Lowest Low over a user-defined period (default: 20 candles).
When a new Higher High forms, it marks a new BSL.
When a new Lower Low forms, it marks a new SSL.
These zones are likely to attract price in the future — either as targets or traps.
Visualization
The indicator draws static horizontal lines (Stepline style) at BSL and SSL levels.
These lines remain in place until broken or a new level is formed.
Visual Labels enhance clarity:
🟢 Green Label → BSL
🔴 Red Label → SSL
Trading Insights / Practical Use
When price approaches a BSL or SSL zone, ask yourself:
✅ Will price break the level to grab liquidity?
✅ Will there be a reversal after liquidity is taken?
The indicator does not provide signals by itself — it serves as a valuable confirmation tool when combined with:
Price Action
Support & Resistance
Momentum Indicators
SMC Tools
Key Benefits
✅ Easy to use
✅ Enhances liquidity analysis
✅ Highlights zones targeted by institutional players
✅ Simple calculation — no complex formulas
Limitations
🚫 Does NOT generate buy/sell signals
🚫 Should be used as part of a complete trading framework
Conclusion
BSL & SSL - Liquidity Zones is a versatile and intuitive tool for any trader looking to better understand where liquidity is positioned on the chart.
It works across all timeframes and complements any trading strategy, especially Smart Money-based approaches.

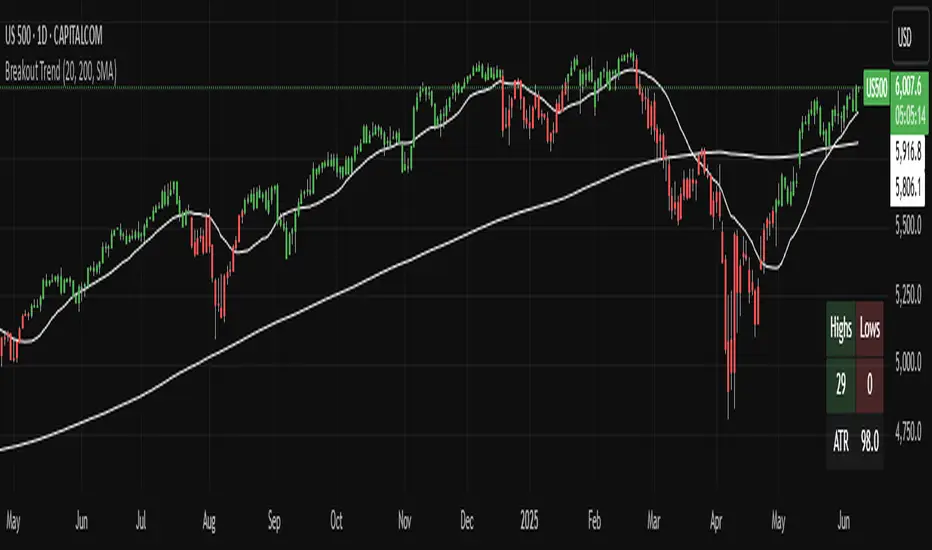
Breakout TrendTiltFolio Breakout Trend indicator
The Breakout Trend indicator is designed to help traders clearly visualize trend direction by combining two complementary techniques: moving averages and Donchian-style breakout logic.
Rather than relying on just one type of signal, this indicator merges short-term and long-term moving averages with breakout levels based on recent highs and lows. The moving averages define the broader trend regime, while the breakout logic pinpoints moments when price confirms directional momentum. This layered approach filters out many false signals while still capturing high-conviction moves.
Yes, these are lagging indicators by design — and that’s the point. Instead of predicting every wiggle, the Breakout Trend waits for confirmation, offering higher signal quality and fewer whipsaws. When the price breaks above a recent high and sits above the long-term moving average, the trend is more likely to persist. That’s when this indicator shines.
While it performs best on higher timeframes (daily/weekly), it's also adaptable to shorter timeframes for intraday traders who value clean, systematic trend signals.
For early signal detection, we recommend pairing this with TiltFolio’s Buying/Selling Proxy, which anticipates pressure buildups—albeit with more noise.
It's easy to read and built for real-world trading discipline.
RSI Buy Sell Signals+ with MFI Cloud [RanaAlgo]Indicator Overview
This indicator combines RSI (Relative Strength Index) with MFI (Money Flow Index) to generate trading signals with additional confirmation filters. The key features include:
RSI Analysis (14-period) with overbought/oversold levels
MFI Cloud (20-period default) showing trend direction via EMAs
Enhanced Signal Generation with volume and trend confirmation options
Visual Elements including colored zones, signal labels, and an information panel
How to Use This Indicator
Basic Interpretation:
Buy Signals (green labels) appear when:
RSI crosses above oversold level (30) OR
RSI shows a rising pattern from oversold zone with volume/trend confirmation (if enabled)
Sell Signals (red labels) appear when:
RSI crosses below overbought level (70) OR
RSI shows a falling pattern from overbought zone with volume/trend confirmation (if enabled)
MFI Cloud provides trend confirmation:
Green cloud = bullish trend (fast EMA > slow EMA)
Red cloud = bearish trend (fast EMA < slow EMA)
Recommended Usage:
For Conservative Trading:
Enable both volume and trend confirmation
Require MFI cloud to align with signal direction
Wait for RSI to clearly exit overbought/oversold zones
For Active Trading:
Combine with price action at key support/resistance levels
Watch for divergence between price and RSI
The Information Panel (top-right) shows:
Current RSI value and status
MFI trend direction
Last generated signal
Current momentum
Customization Options:
Adjust RSI/MFI lengths for sensitivity
Modify overbought/oversold levels
Toggle volume/trend confirmation requirements
Adjust visual elements like cloud opacity and zone visibility

LRCLRC (Linear Regression Candle)
Overview
The LRC (Linear Regression Candle) indicator applies linear regression to the open, high, low, and close prices, creating smoothed "candles" that help filter market noise. It provides trend-confirmation signals and highlights potential reversal points based on regression crossovers.
Key Features
Smoothed Candles: Uses linear regression to calculate synthetic OHLC values, reducing noise.
Multi-Timeframe Support: Optional higher timeframe analysis for better trend confirmation.
Visual Signals: Color-coded candles and labels highlight bullish/bearish control zones.
Customizable Settings: Adjustable regression length, colors, and timeframe options.
How to Use
Signals & Interpretation
🟢 Bullish Signal (BUY): When the regression open crosses above the regression close (green candle).
🔴 Bearish Signal (SELL): When the regression open crosses below the regression close (red candle).
Control Zones:
Strong Bullish (Controlbull): Confirmed uptrend (bright green).
Bullish (Bull): Regular uptrend (light green).
Strong Bearish (Controlbear): Confirmed downtrend (dark red).
Bearish (Bear): Regular downtrend (orange).
Neutral (Gray): No clear trend.
Recommended Settings
Linear Regression Length: Default 8 (adjust for sensitivity).
Timeframe: Default current chart, but can switch to higher timeframes (e.g., 1D, 1W).
Bar Colors: Toggle on/off for visual clarity.
Labels: Displays "Control" markers at key reversal points.
Example Use Cases
Trend Confirmation: Use higher timeframe LRC to validate the primary trend.
Reversal Signals: Watch for BUY/SELL crossovers with strong color confirmation.
Noise Reduction: Helps avoid false breakouts in choppy markets.

OpenAI Signal Generator - Enhanced Accuracy# AI-Powered Trading Signal Generator Guide
## Overview
This is an advanced trading signal generator that combines multiple technical indicators using AI-enhanced logic to generate high-accuracy trading signals. The indicator uses a sophisticated combination of RSI, MACD, Bollinger Bands, EMAs, ADX, and volume analysis to provide reliable buy/sell signals with comprehensive market analysis.
## Key Features
### 1. Multi-Indicator Analysis
- **RSI (Relative Strength Index)**
- Length: 14 periods (default)
- Overbought: 70 (default)
- Oversold: 30 (default)
- Used for identifying overbought/oversold conditions
- **MACD (Moving Average Convergence Divergence)**
- Fast Length: 12 (default)
- Slow Length: 26 (default)
- Signal Length: 9 (default)
- Identifies trend direction and momentum
- **Bollinger Bands**
- Length: 20 periods (default)
- Multiplier: 2.0 (default)
- Measures volatility and potential reversal points
- **EMAs (Exponential Moving Averages)**
- Fast EMA: 9 periods (default)
- Slow EMA: 21 periods (default)
- Used for trend confirmation
- **ADX (Average Directional Index)**
- Length: 14 periods (default)
- Threshold: 25 (default)
- Measures trend strength
- **Volume Analysis**
- MA Length: 20 periods (default)
- Threshold: 1.5x average (default)
- Confirms signal strength
### 2. Advanced Features
- **Customizable Signal Frequency**
- Daily
- Weekly
- 4-Hour
- Hourly
- On Every Close
- **Enhanced Filtering**
- EMA crossover confirmation
- ADX trend strength filter
- Volume confirmation
- ATR-based volatility filter
- **Comprehensive Alert System**
- JSON-formatted alerts
- Detailed technical analysis
- Multiple timeframe analysis
- Customizable alert frequency
## How to Use
### 1. Initial Setup
1. Open TradingView and create a new chart
2. Select your preferred trading pair
3. Choose an appropriate timeframe
4. Apply the indicator to your chart
### 2. Configuration
#### Basic Settings
- **Signal Frequency**: Choose how often signals are generated
- Daily: Signals at the start of each day
- Weekly: Signals at the start of each week
- 4-Hour: Signals every 4 hours
- Hourly: Signals every hour
- On Every Close: Signals on every candle close
- **Enable Signals**: Toggle signal generation on/off
- **Include Volume**: Toggle volume analysis on/off
#### Technical Parameters
##### RSI Settings
- Adjust `rsi_length` (default: 14)
- Modify `rsi_overbought` (default: 70)
- Modify `rsi_oversold` (default: 30)
##### EMA Settings
- Fast EMA Length (default: 9)
- Slow EMA Length (default: 21)
##### MACD Settings
- Fast Length (default: 12)
- Slow Length (default: 26)
- Signal Length (default: 9)
##### Bollinger Bands
- Length (default: 20)
- Multiplier (default: 2.0)
##### Enhanced Filters
- ADX Length (default: 14)
- ADX Threshold (default: 25)
- Volume MA Length (default: 20)
- Volume Threshold (default: 1.5)
- ATR Length (default: 14)
- ATR Multiplier (default: 1.5)
### 3. Signal Interpretation
#### Buy Signal Requirements
1. RSI crosses above oversold level (30)
2. Price below lower Bollinger Band
3. MACD histogram increasing
4. Fast EMA above Slow EMA
5. ADX above threshold (25)
6. Volume above threshold (if enabled)
7. Market volatility check (if enabled)
#### Sell Signal Requirements
1. RSI crosses below overbought level (70)
2. Price above upper Bollinger Band
3. MACD histogram decreasing
4. Fast EMA below Slow EMA
5. ADX above threshold (25)
6. Volume above threshold (if enabled)
7. Market volatility check (if enabled)
### 4. Visual Indicators
#### Chart Elements
- **Moving Averages**
- SMA (Blue line)
- Fast EMA (Yellow line)
- Slow EMA (Purple line)
- **Bollinger Bands**
- Upper Band (Green line)
- Middle Band (Orange line)
- Lower Band (Green line)
- **Signal Markers**
- Buy Signals: Green triangles below bars
- Sell Signals: Red triangles above bars
- **Background Colors**
- Light green: Buy signal period
- Light red: Sell signal period
### 5. Alert System
#### Alert Types
1. **Signal Alerts**
- Generated when buy/sell conditions are met
- Includes comprehensive technical analysis
- JSON-formatted for easy integration
2. **Frequency-Based Alerts**
- Daily/Weekly/4-Hour/Hourly/Every Close
- Includes current market conditions
- Technical indicator values
#### Alert Message Format
```json
{
"symbol": "TICKER",
"side": "BUY/SELL/NONE",
"rsi": "value",
"macd": "value",
"signal": "value",
"adx": "value",
"bb_upper": "value",
"bb_middle": "value",
"bb_lower": "value",
"ema_fast": "value",
"ema_slow": "value",
"volume": "value",
"vol_ma": "value",
"atr": "value",
"leverage": 10,
"stop_loss_percent": 2,
"take_profit_percent": 5
}
```
## Best Practices
### 1. Signal Confirmation
- Wait for multiple confirmations
- Consider market conditions
- Check volume confirmation
- Verify trend strength with ADX
### 2. Risk Management
- Use appropriate position sizing
- Implement stop losses (default 2%)
- Set take profit levels (default 5%)
- Monitor market volatility
### 3. Optimization
- Adjust parameters based on:
- Trading pair volatility
- Market conditions
- Timeframe
- Trading style
### 4. Common Mistakes to Avoid
1. Trading without volume confirmation
2. Ignoring ADX trend strength
3. Trading against the trend
4. Not considering market volatility
5. Overtrading on weak signals
## Performance Monitoring
Regularly review:
1. Signal accuracy
2. Win rate
3. Average profit per trade
4. False signal frequency
5. Performance in different market conditions
## Disclaimer
This indicator is for educational purposes only. Past performance is not indicative of future results. Always use proper risk management and trade responsibly. Trading involves significant risk of loss and is not suitable for all investors.
